The Relationship Between Age, Usage, and 3FG%
In my last two posts I have taken a look at modeling a player’s 3FG% based on their age, and I’ve also estimated the relationship between usage and 3FG%. In this post I would like to bring these two topics together and estimate the relationship between age, usage, and 3FG%.
The Data
To put this data set together I again used Basketball-Reference.com’s Player Season Finder, but this time I collected the advanced statistics to go along with the player’s 3pt makes and attempts. Also, I used more years of data, as this data set is from the 1989-90 to 2008-09 seasons.
My original threshold for including the player season in the data set was to require at least two 3pt shot attempts during the season. I have, however, increased this threshold to eighty two 3pt shot attempts in an effort to isolate the data set to only players that we expect to shoot 3pt shots. This means that I’m attempting to quantify those players that are “regular” or “semi-regular” 3pt shooters and disregard those that do not consider the 3pt shot a part of their game.
The Model
To estimate the relationship between age, usage, and 3FG%, I’ve fit the following model:
[latex]Pr({\tt 3FG make}) = {\tt logit}^{-1}(\alpha + \beta_{1}({\tt USG\%}) + \beta_{2}({\tt age}) + \beta_{3}({\tt age}^{2}))[/latex]
I fit this logistic regression as a multilevel model to allow the intercept and coefficients for USG% and the age quadratic to all vary by player. This type of model allows us to estimate the player ability while allowing us to estimate individual USG% lines and individual player aging curves.
The Results
The average player results are as follows:
- Coefficients: [latex]\alpha = -1.62[/latex], [latex]\beta_{1} = -0.0061[/latex], [latex]\beta_{2} = 0.081[/latex], [latex]\beta_{3} = -0.00136[/latex]. The p-values for testing if the true values of these parameters are equal to zero are all less than 0.01.
- USG%: The coefficient for usage, [latex]\beta_{1} = -0.0061[/latex], suggests that for each additional 1% in an individual’s USG% the odds the individual makes a 3FG attempt are decreased by 0.6%. As we would expect, this suggests that a player that increases their usage from 20% to 21% would expect to see their odds of making a 3pt FG attempt decrease by 0.6%
- Age: The coefficients for the aging curve, [latex]\beta_{2} = 0.081[/latex] and [latex]\beta_{3} = -0.00136[/latex], suggest that the average player’s peak in 3pt shooting ability occurs when they are 30 years old.
Trevor Ariza
Trevor Ariza was the source of the original motivation for looking at the relationship between usage and 3FG%, so I thought it would be appropriate to present a graph of his estimated aging curve at usage levels of 10% (blue), 20% (black), and 30% (red). The dots represent the sample 3FG% for Trevor at the specified age:
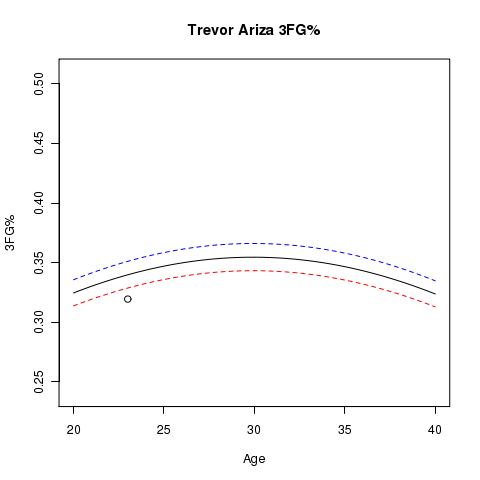
One thing you’ll notice is that we only have one data point on this graph. This is because Trevor did not shoot many 3pt shots until last season with the Lakers.
That said, using just last year’s data for Ariza we would predict him to shoot 34% this year with the Rockets at age 24 using 23.6% of his lineup’s possessions. Thus far this year he’s shooting 34.3%. Don’t read too much into the closeness of this predicted% to his actual%, as a 95% confidence interval for his 3FG% this year is (26.6%, 42.8%).
One thing to note is that this model suggests that last year’s 31.9% performance isn’t a fair representation of his true ability. This model estimates his fair ability of making a 3pt FG attempt to be 34.3% last year with the Lakers at age 23 using 16.7% of his lineup’s possessions.
Other Players
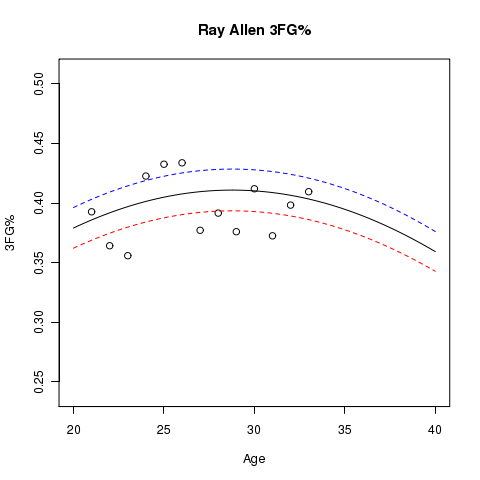
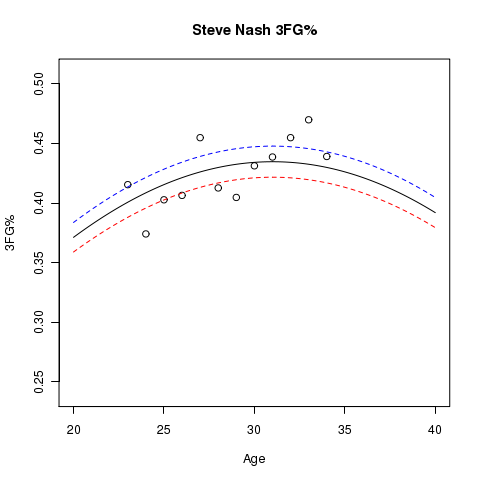
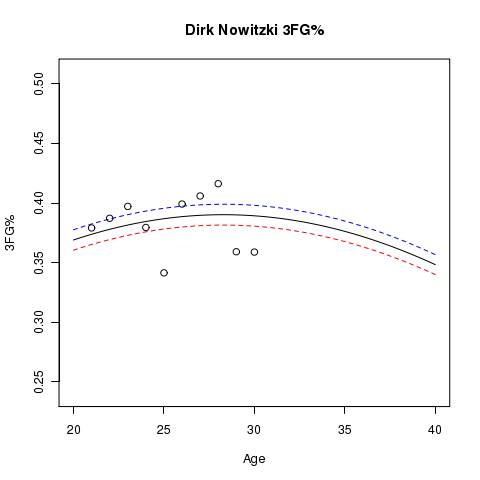
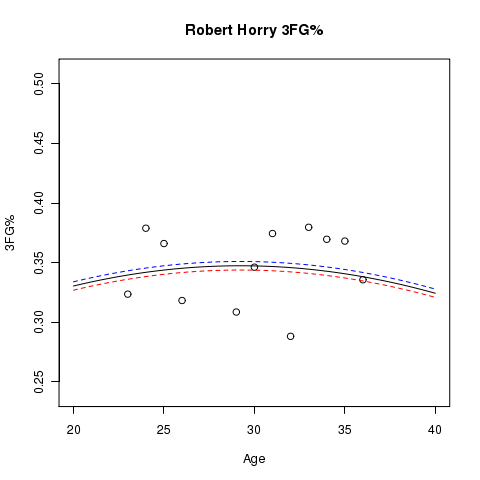
Here are some other player graphs that have more than a single season’s data, where lines for the estimated aging curve at usage levels of 10% (blue), 20% (black), and 30% (red) are shown. The dots represent the sample 3FG% for the players at the specified age:
More Work…
The next step is to try and validate these models using out of sample data. One thing I would like to do is to use cross-validation to measure the expected prediction error of this model. Also, I would like to quantify the uncertainty around these estimates. Current efforts to do this have left me unsatisfied, but there are certainly some confidence bounds we could generate for these estimtes, and they should prove to be worthwhile to create.
I’ll have to wait to do this, as my final exams start tomorrow, and I’ve blown off studying for them about as long as I possibly can. 8)
The Tradeoff Between Usage and 3FG%
My last post on the relationship between age and 3FG%, Brian Tung brought up a topic that I’ve wanted to look at:
… I’m not even sure that history is necessarily a good guide here, as players shoot those treys under fairly different circumstances at different stages of their careers. Who’s to say that Ariza, for example, is going to get the same looks this year as one of the primary options as opposed to last year as one of the secondary options?
Thanks to the work of Eli Witus, I’d like to see what we can say about situations like Ariza’s.
The Goal
The goal of this study is to determine what relationship usage% has on 3FG%. For the uninitiated, usage% is the proportion of a lineup’s possessions an individual player is responsible for. See Basketball on Paper for the full details.
Collecting the Data
To estimate this relationship, I’ve collected the number of 3pt makes and misses for each lineup from the 2006-07 to 2008-09 seasons. I also kept track of which shots were from the corner, and I’ve captured each player’s individual usage% for the season from play-by-play data.
With this data I constructed a data set that consists of how many 3pt shots were made and missed, if the shots took place in the corner, and the sum of the individual usage%s for each lineup. Lastly, the sum of the individual usage%s for each lineup were centered around one. This is done to estimate how much “more” or “less” the lineup must do relative to what the individual usage%s would indicate. For example, if the usage%s sum to 1.05, relative to one this is +0.05. Hence we would expect this lineup to take “less” of a load and increase their shooting percentages.
Lastly, I predict the effective FG% of 3pt shots of each lineup based on the likelihood that each player in the lineup attempts a 3pt shot and their probability of making these 3pt shots, where the difference between making a corner and non-corner 3pt shot are taken into account. (These predictions are made conditional on knowing some player in the lineup took a 3pt shot.)
Fitting the Model
I’ve chosen to fit this model with a linear regression, so like Eli’s efficiency study, I’m using the difference between the predicted effective FG% of 3pt shots and the actual effective FG% of 3pt shots as the response variable and the relative difference from one of the summed usage%s as the predictor.
In 2008-09, the estimated coefficient for usage% is 0.131 with a p-value < 0.01. 2007-08, the estimated coefficient for usage% is 0.087 with a p-value of 0.06. In 2006-07, the estimated coefficient for usage% is 0.046 with a p-value of 0.33. When fit to all three seasons of data, the estimated coefficient for usage% is 0.09 with a p-value < 0.01. A 95% confidence interval for this coefficient is (0.039, 0.142).
Interpreting the Results
Using the model fit to all three seasons of data, the estimated coefficient suggests that for each 0.01 increase in the sum of the individual player’s usage%s we expect the lineup’s effective FG% on 3pt shots to increase by 0.09%.
At the player level we would estimate that each 0.01 decrease in a player’s usage% would increase the effective FG% of their 3pt shots by 0.45%.
In Ariza’s case, we would estimate that a change from using 16.3% of his lineup’s possessions to 21.8% (a net -5.5%) would decrease his effective FG% of 3pt shots by 2.5%. The actual estimated change from last year with the Lakers and this year with the Rockets is -1.7% on corner 3pt shots and -3.4% on other 3pt shots.
Future Work
Even though we have some evidence to suggest an increase in usage% will decrease a player’s effective FG% on 3pt shots, we know that age and other factors affect 3FG%. Thus in the future I would like to determine how much confidence we have in out of sample predictions when taking into account usage%, age, etc. The goal of this study was to present the estimates from in-sample data, but more work needs to be done to determine how useful this is for making predictions about the future in a new season.
Estimating the Impact of Aging on 3FG%
The impact of aging on player performance interests me, but I haven’t really done anything useful in this area. Baseball’s recent debate (really fantastic stuff) on the topic of player aging curves has motivated me to take a closer look at the affect of aging on 3pt shooting.
Ed Küpfer’s three year old post on aging is the best resource I know of on the topic, but I’m sure he’s got something more useful than what’s in that post. That said, I’d like to specifically estimate an aging curve for the 3pt shooting abilities of NBA players.
The Data
Using Basketball-Reference.com‘s excellent Player Season Finder, I collected 3pt shooting data for players that attempted at least two 3pt shots during any season from 1999-00 to 2008-09. This resulted in a data set containing a little over 3300 player seasons.
The Model
Individual 3pt shooting performance is more than a function of player ability and age, but in this case I’m specifically interested in estimating the affect of age. Further, I would like to estimate an aging curve for each player under the assumption that each player has their own unique aging curve.
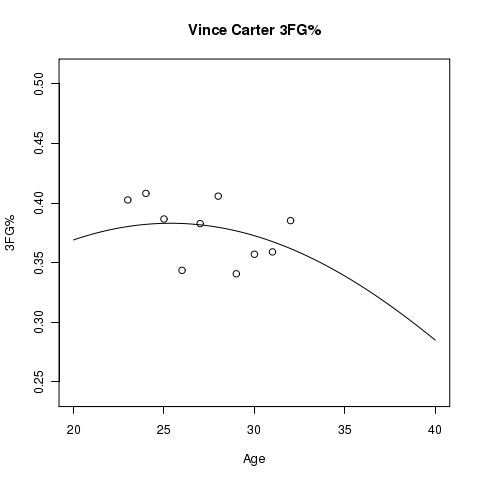
To do this, I’ve chosen to use a multilevel model that allows the intercept and slope to vary by player, as this model allows for the estimation of a unique aging curve for each player. The aging curve is assumed to be of the form [latex]\alpha + \beta_{0}(age) + \beta_{1}(age^{2})[/latex].
The Results
The model fit estimates the the average player’s peak age in 3pt shooting ability is 29, and the p-values for the [latex]\beta_{0}[/latex] and [latex]\beta_{1}[/latex] coefficients in the model form listed above are both less than 0.01.
The estimates for each player are listed in the following spreadsheet: 3FG% Aging Estimates
In this spreadsheet you will find each player’s estimated peak age along with 3FG% estimates for each player from age 20 to 40.
With the exception of Andre Miller, most peak ages are plausible. For a player like Miller, the model suggests his 3pt shooting ability has been declining since starting his NBA career.
Individual Players
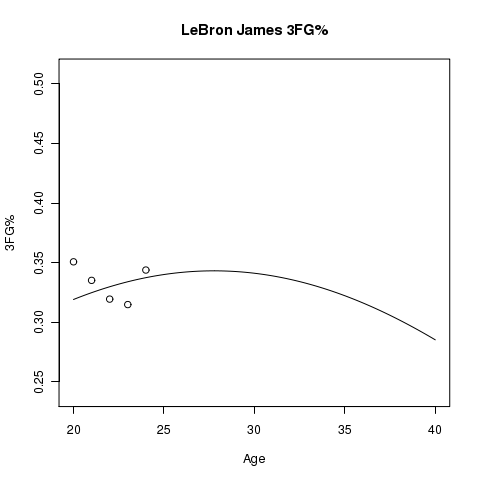
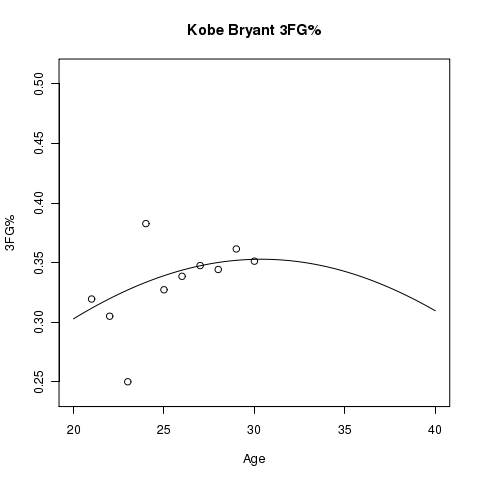
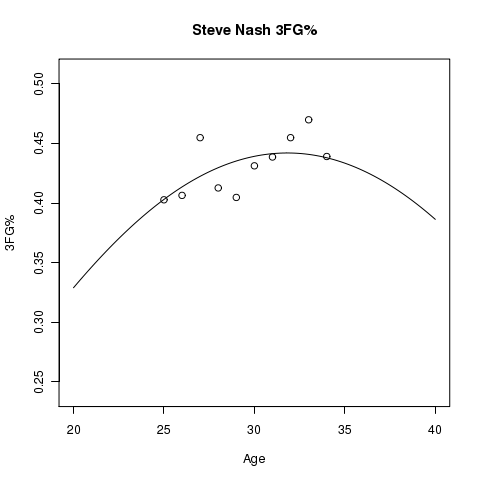
Below you will find graphs of estimated aging curves for some player’s 3FG%. In addition to the estimated aging curve, you will see points plotted that represent the actual 3FG% for the player at the specified age.
There is Uncertainty…
These are just estimates, and it is important to point out that uncertainty exists around these estimates. I’ve tried to simulate confidence bounds for this model without success, but even though I’m not representing the uncertainty, keep in mind that it does exist.
Improving this Model
The debate in the baseball community suggests it’s incorrect to simply assume players have this type of aging curves. Although this type of curve appears to be a decent approximation, perhaps there are better ways to estimate the impact of a player’s age on 3FG%. Other than trying to control for other explanatory variables, trying to fit other model types might prove worthwhile.
Estimating Individual Impact on Defensive Efficiency
Earlier this week in @johnschuhmann‘s excellent column The Numbers Game, John looks at how Andre Miller impacts defensive efficiency. This, along with @kpelton‘s note that “the Blazers have been more effective defensively when Joel Przybilla is playing than when Greg Oden is playing” (from Blazersedge) has helped motivate me to look at what estimates we can draw about the impact these players have on defensive efficiency. The goal of this study is to do two things: 1) estimate the impact these players have on defensive efficiency, and 2) quantify the uncertainty we have about these estimates.
Constructing the Model
I have been doing some research to figure out how to best model the number of points teams score and allow on an individual possession, so I will be using that type of model for creating these estimates of an individual’s impact on defensive efficiency. The biggest difference between what I’m doing and adjusted plus/minus is that I consider what happens on each possession rather than what happens over a span of possessions for each combination of players. This means that I can better estimate the individual impact on allowing points to be scored on an individual possession rather than simply estimating the individual impact on the mean number of points allowed per hundred possessions.
There are many different ways to construct this model for estimating individual player impact on defensive efficiency, but I’ve chosen the modeling option I feel most comfortable with:
- Fitting the model using all NBA possessions, where individual teams, Blazers’ players, home court advantage, number of offensive reserves, and being in the penalty are considered as predictors.
This modeling option controls for things we know to be important like opposing team strength, home court advantage, number of offensive reserves, and being in the penalty. The number of offensive reserves is intended to be a proxy for individual opponent strength. Although that was the intention, it is also true that the number of offensive reserves is correlated with game situation, like blowouts. Thus this is certainly one area of the model that can be improved on in the future.
Examining Andre Miller’s Defense
In The Numbers Game, John first writes about what Andre did with Philadelphia last year, so I’ll start there: what was Andre’s impact on Philadelphia’s defense? To measure this, we need a player to compare him against. Like John, I will compare Andre to Lou Williams.
To do a comparison in terms of efficiency, I must select teammates for these players. In this case, I have chosen the players from Philadelphia’s most used lineup last year: Andre Iguodala, Samuel Dalembert, Thaddeus Young, and Willie Green. Also, these estimates of defensive efficiency come from assuming there are zero opponent reserve players and that the lineup is not in the penalty.
Under these assumptions, the model estimates that this lineup with Andre performs at 0.18 points per hundred possessions worse than with Lou. A 95% confidence interval for this estimate is (-9.4, 9.2). This estimated difference is small, and there is a lot of uncertainty around this estimate. Even after a full season we do not have much confidence in saying either player has a better impact on defensive efficiency in the context of this lineup. Strictly in terms of defensive efficiency, this model suggests we could plausibly get by with either player. Defense is only half of the game, but for our purposes of evaluating defense we wouldn’t prefer one player over the other.
Thus this analysis doesn’t agree with John’s conclusion that “… Miller’s -3.2 differential was aided by the amount of time he spent on the floor next to Iguodala and Thaddeus Young, but Lou Williams’ +5.9 differential last season makes it pretty clear that he’s not the defender that Miller is.” This model suggests that Andre Iguodala and Thaddeus Young were Philadelphia’s best defenders last year, so perhaps this means that John isn’t giving them enough credit for what they’re doing on defense.
Andre Miller versus Steve Blake
Looking at last year is fun, but what we’re most interested in right now is comparing Andre’s defensive impact to the defensive impact of one of his current teammates, Steve Blake. To estimate the difference between Andre’s and Steve’s impact on defensive efficiency, I’ve selected Brandon Roy, Greg Oden, LaMarcus Aldridge, and Martell Webster to be their teammates.
Under these conditions, the model estimates that the lineup with Andre performs 0.05 points per hundred possessions worse than the lineup with Steve Blake. A 95% confidence interval for this difference is (-15.3, 13.8), and this means that similar to Andre versus Lou, the model suggests that we shouldn’t prefer either player in terms of their defensive impact.
Greg Oden versus Joel Przybilla
Although Kevin Pelton pointed out the difference between Greg’s and Joel’s defensive play this year, I want to first look at what conclusion we’d draw about the defensive play of these players at the end of last year. To do this, I’ve selected Brandon Roy, LaMarcus Aldridge, Nicolas Batum, and Steve Blake to be their teammates.
Under these conditions, the model estimates that the lineup with Greg performs 6.6 points per hundred possessions worse than the lineup with Joel. A 95% confidence interval for this difference is (0.65, 13.1), suggesting that we can be confident that in 2008-09 Joel’s defensive impact with this lineup was better than Greg’s defensive impact with this lineup.
For this season’s estimate I have selected Andre Miller, Bradon Roy, LaMarcus Aldridge, and Steve Blake to be their teammates. Under these conditions, the model estimates that the lineup with Greg Oden performs 5.9 points per hundred possessions worse than the lineup with Joel Przybilla.
A 95% confidence interval for this difference is (-7.0, 17.1), and this means that even though we estimate Joel’s defensive impact with this lineup to better than Greg’s impact with this lineup, we need more data before we can confidently make this statement like we could in 2008-09. Because the estimate is practically significant, I’d still prefer Joel over Greg if forced to make a choice strictly in terms of defensive impact.
But…
This model isn’t perfect. The way I control for individual opponent strength could be improved. And even though this type of model has the best of intentions, it will not tell us why players are having the impacts we estimate. It gives us more information than adjusted +/-, such as the impact an individual has on the specific number of points given up on defense, but we can still make use of other statistics for trying to dig into the why. Even these other statistics don’t tell us everything, so it is not surprising to me that coaches prefer video to statistics.
Lastly, this analysis doesn’t exactly clear up any debates Blazers’ fans may be having, like should Andre or Steve be starting, or should Greg or Joel get more playing time? This model is just one way of looking at the data, and defense counts for just half of what teams do to win games. Thus I’ll leave it up to rabid Blazers’ fans to weigh the deficiencies of this model and to figure out which players are better on offense. 🙂
Power Rankings, SSR Updates, and More
Over the past few days I’ve done a little house keeping and updated various sections of the website. Here is a quick list of the updates:
- NBA Power Rankings: @kpelton‘s recent Basketball Prospectus article inspired me to rank and rate NBA teams using some of the more recent tools I’ve added to my toolbox. You can find these power rankings at the new NBA Power Rankings section of the website, and these rankings will be updated daily.
- Statistical Scouting Reports: After initially releasing 2008-09 offensive statistical scouting reports, I’ve added 2009-10 data to go along with 2007-08 and 2006-07 data. One word of caution about the 2009-10 data: if you see range values that have the same numbers on the left and right (i.e. 50%-50%), then this means the models do not detect a difference between players at that position for the given statistic. This means we don’t have enough data yet, so don’t go too crazy when you see these kinds of numbers for some player statistics. I’ve also added some defensive measures to these reports. I’m not satisfied with the current groupings of some of the stats, so if you have any suggestions please voice them.
- Play-by-Play Data: I’ve created an archive for last year’s 2008-09 play-by-play data, and you can now download play-by-play data from the 2009-10 regular season. The 2009-10 play-by-play data should be updating on a daily basis. Please let me know if you find any errors, and enjoy!
I hope you find these updates useful!