The Relationship Between Age, Usage, and 3FG%
- 1,075 Comment
In my last two posts I have taken a look at modeling a player’s 3FG% based on their age, and I’ve also estimated the relationship between usage and 3FG%. In this post I would like to bring these two topics together and estimate the relationship between age, usage, and 3FG%.
The Data
To put this data set together I again used Basketball-Reference.com’s Player Season Finder, but this time I collected the advanced statistics to go along with the player’s 3pt makes and attempts. Also, I used more years of data, as this data set is from the 1989-90 to 2008-09 seasons.
My original threshold for including the player season in the data set was to require at least two 3pt shot attempts during the season. I have, however, increased this threshold to eighty two 3pt shot attempts in an effort to isolate the data set to only players that we expect to shoot 3pt shots. This means that I’m attempting to quantify those players that are “regular” or “semi-regular” 3pt shooters and disregard those that do not consider the 3pt shot a part of their game.
The Model
To estimate the relationship between age, usage, and 3FG%, I’ve fit the following model:
[latex]Pr({\tt 3FG make}) = {\tt logit}^{-1}(\alpha + \beta_{1}({\tt USG\%}) + \beta_{2}({\tt age}) + \beta_{3}({\tt age}^{2}))[/latex]
I fit this logistic regression as a multilevel model to allow the intercept and coefficients for USG% and the age quadratic to all vary by player. This type of model allows us to estimate the player ability while allowing us to estimate individual USG% lines and individual player aging curves.
The Results
The average player results are as follows:
- Coefficients: [latex]\alpha = -1.62[/latex], [latex]\beta_{1} = -0.0061[/latex], [latex]\beta_{2} = 0.081[/latex], [latex]\beta_{3} = -0.00136[/latex]. The p-values for testing if the true values of these parameters are equal to zero are all less than 0.01.
- USG%: The coefficient for usage, [latex]\beta_{1} = -0.0061[/latex], suggests that for each additional 1% in an individual’s USG% the odds the individual makes a 3FG attempt are decreased by 0.6%. As we would expect, this suggests that a player that increases their usage from 20% to 21% would expect to see their odds of making a 3pt FG attempt decrease by 0.6%
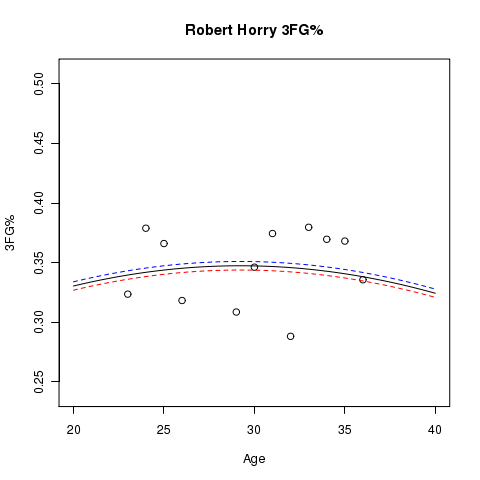
- Age: The coefficients for the aging curve, [latex]\beta_{2} = 0.081[/latex] and [latex]\beta_{3} = -0.00136[/latex], suggest that the average player’s peak in 3pt shooting ability occurs when they are 30 years old.
Trevor Ariza
Trevor Ariza was the source of the original motivation for looking at the relationship between usage and 3FG%, so I thought it would be appropriate to present a graph of his estimated aging curve at usage levels of 10% (blue), 20% (black), and 30% (red). The dots represent the sample 3FG% for Trevor at the specified age:
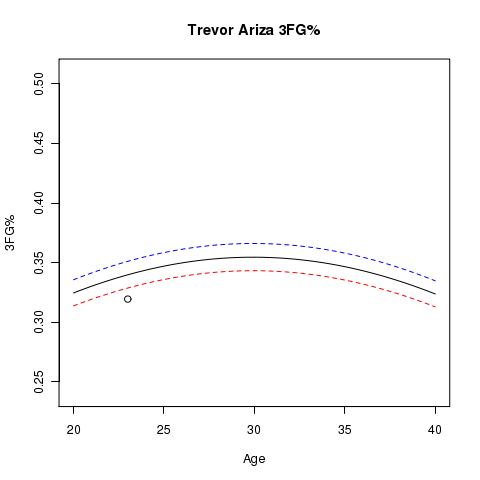
One thing you’ll notice is that we only have one data point on this graph. This is because Trevor did not shoot many 3pt shots until last season with the Lakers.
That said, using just last year’s data for Ariza we would predict him to shoot 34% this year with the Rockets at age 24 using 23.6% of his lineup’s possessions. Thus far this year he’s shooting 34.3%. Don’t read too much into the closeness of this predicted% to his actual%, as a 95% confidence interval for his 3FG% this year is (26.6%, 42.8%).
One thing to note is that this model suggests that last year’s 31.9% performance isn’t a fair representation of his true ability. This model estimates his fair ability of making a 3pt FG attempt to be 34.3% last year with the Lakers at age 23 using 16.7% of his lineup’s possessions.
Other Players
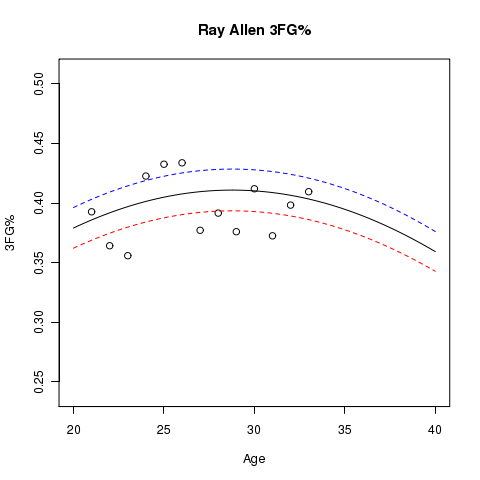
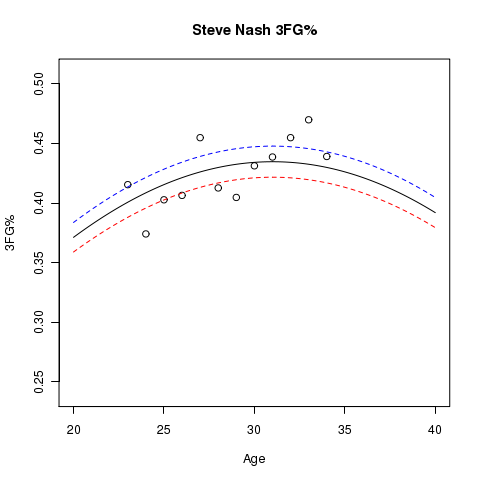
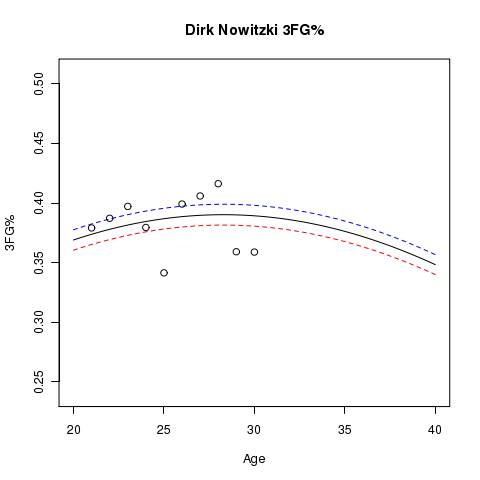
Here are some other player graphs that have more than a single season’s data, where lines for the estimated aging curve at usage levels of 10% (blue), 20% (black), and 30% (red) are shown. The dots represent the sample 3FG% for the players at the specified age:
More Work…
The next step is to try and validate these models using out of sample data. One thing I would like to do is to use cross-validation to measure the expected prediction error of this model. Also, I would like to quantify the uncertainty around these estimates. Current efforts to do this have left me unsatisfied, but there are certainly some confidence bounds we could generate for these estimtes, and they should prove to be worthwhile to create.
I’ll have to wait to do this, as my final exams start tomorrow, and I’ve blown off studying for them about as long as I possibly can. 8)
is it ok to take 100mg of Sildenafil
is Sildenafil available over counter
The Relationship Between Age, Usage, and 3FG%
https://eggbeforechicken.com/2021/08/19/electric-sky-2021-gamification/
اول جامعة يمنية تدخل تصنيف التايمز
[…]Wonderful story, reckoned we could combine some unrelated data, nevertheless actually really worth taking a appear, whoa did one learn about Mid East has got a lot more problerms too […]
مجلة جامعة الملكة أروى
[…]just beneath, are many entirely not associated web-sites to ours, even so, they may be surely worth going over[…]
Queen Arwa University EDURank
[…]The facts mentioned within the post are a few of the best accessible […]
samsung taşınabilir ssd
samsung taşınabilir ssd
918kiss
[…]Every the moment inside a though we select blogs that we study. Listed below would be the most up-to-date internet sites that we choose […]
The Relationship Between Age, Usage, and 3FG%
http://authentisch-leben-und-glauben.de/2012/02/26/ankommen-zu-hause-sein/
vidalista 20
vidalista vs cialis
levitra 20
canadian levitra
Sildenafil 100 mg para que sirve
Sildenafil 100mg Tablets for Sale
medicine proscar
buy proscar
Cenforce for sale online
Cenforce 200 review
p force 100mg
p force tablets price
furosemide 20 mg picture
furosemide ca
The Relationship Between Age, Usage, and 3FG%
https://bluerivercostarica.com/content-creation/connecting-with-natures-tranquil-essence/
The Relationship Between Age, Usage, and 3FG%
https://www.kucukkeskin.com.tr/orion-profline/
seroflo 250 inhaler
cipla seroflo 125
Cenforce 100mg ca
Cenforce d reviews
shorts
shorts
The Relationship Between Age, Usage, and 3FG%
https://w-audio.cz/component/k2/item/33?limit=10
buy kamagra jelly online
is kamagra safe
albuterol inhaler for bronchitis
ipratropium bromide and albuterol sulfate
albuterol hfa inhaler
ventolin tablet price
kamagra online uk next day delivery
cheap kamagra jelly