The Relationship Between Shooting and Defensive Efficiency
- 6 Comment
In my last post I took a broad look at how the four factors impact a lineup’s defensive efficiency. This post will take a closer look at the most important factor: shooting.
As a refresher, the data I am using comes from each team’s most used lineup during the ’07-’08 season (view the lineups). I am using a single lineup from each team in an attempt to understand how coaching and the individual players affect defense.
Certainly we would want to use more lineups to try and make inferences about the league as a whole, but that’s not really the goal right now. Ideally, though, the inferences we make about these 5-player unit statistics will be similar to those we make about the entire league.
Breaking Down Shooting
As we learned last time, a lineup’s points per field goal attempt from this data set has a 0.928 correlation with defensive efficiency. No surprise here, but shooting matters more than anything else with respect to defensive efficiency. The point of this study is to examine if there are specific aspects of shooting that matter more than others.
At its most basic level, shooting can be broken down into two areas: 2pt versus 3pt shooting. We can go further, however, and divy 2pt shots up into the low paint (within 6 feet of the basket), the high paint (all other shots in the paint), and mid-range shots (all other 2pt shots). For 3pt shots, we can consider 3pt shots from the corners versus all other 3pt shots.
We could further divide these areas into even smaller regions, but for now I will focus on these 5 general areas: the low paint, high paint, mid-range, corner 3s, and all other 3s.
The 2pt versus 3pt Shot
Before breaking things down further, it’s worth looking at the relationship between 2pt shots, 3pt shots and defensive efficiency. We already know the relationship between overall shot distribution (in terms of points per FGA) and defensive efficiency, but what about the actual shooting percentages from each area?
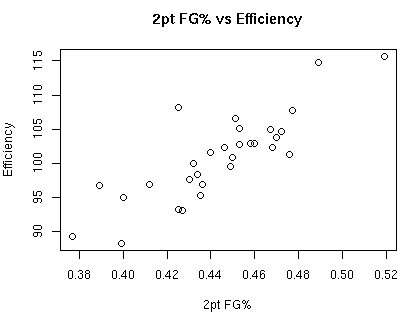
The correlation between 2pt FG% and defensive efficiency is 0.834.
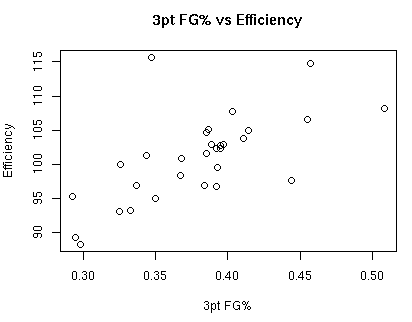
The correlation between 3pt FG% and defensive efficiency is 0.689.
Clearly the distribution of 2pt versus 3pt shots (which has a direct relationship to points per FGA) is most important. That being said, what sort of relationship exists between the distribution of 2pt shots versus 3pt shots and defensive efficiency?
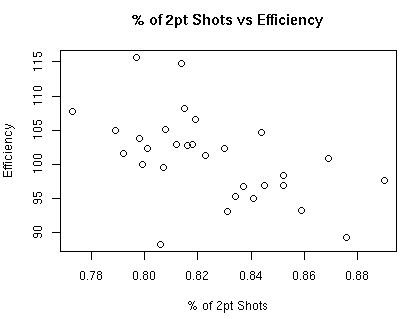
The correlation between the % of shots that are from 2pt range and defensive efficiency is -0.521.
The correlation between the % of shots that are from 3pt range and defensive efficiency is just the inverse relationship to the % of shots that are from 2pt range.
Breaking Down 2pt Shots
As mentioned earlier, I am breaking down 2pt shots into 3 areas: the low paint, the high paint, and mid-range. The low paint is the area in the paint within 6 feet of the basket, the high paint is all other 2pt shots in the paint, and mid-range is all other 2pt shots.
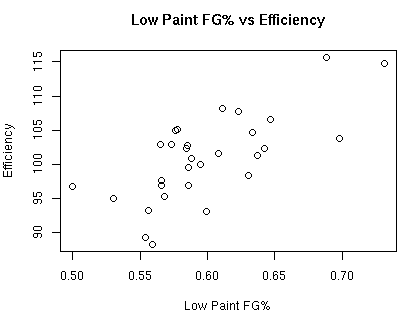
The correlation between low paint FG% and defensive efficiency is 0.707.
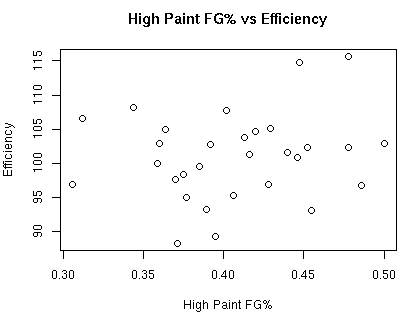
The correlation between high paint FG% and defensive efficiency is 0.177.
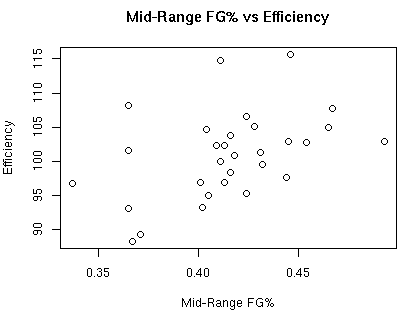
The correlation between mid-range FG% and defensive efficiency is 0.438.
So what about the relationship between the shot distribution of low paint versus high paint versus mid-range shots with respect to overall shot selection? The correlation between % of shots that are in the low paint is 0.155, % of shots that are in the high paint is -0.144, and % of shots that are from mid-range is -0.232.
Breaking Down 3pt Shots
The two areas I will examine for 3pt shots is corner 3pt shots versus all other 3pt shots.
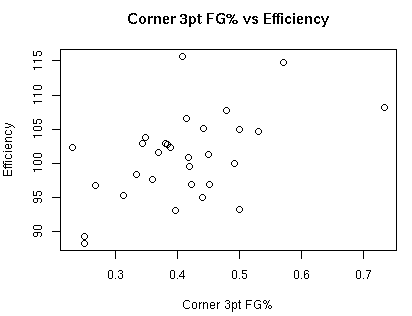
The correlation between corner 3pt shots and defensive efficiency is 0.505.
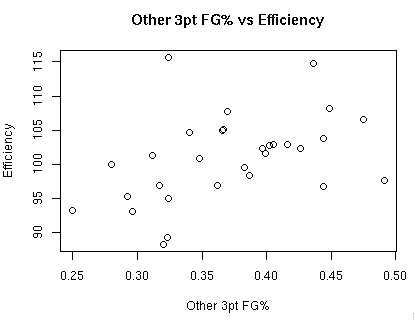
The correlation between all other 3pt shots and defensive efficiency is 0.426.
The correlation for % of shots that are from the corner and defensive efficiency is 0.323, where as the correlation for % of shots that are not from the corner and defensive efficiency is 0.489.
Summary
Talking about correlations isn’t a lot of fun or sexy, but it’s the best way I know of to express the relationship between these shooting statistics and defensive efficiency.
The first point I want to make is that these correlations may not be a good representation for the entire NBA. This analysis is specifically to examine these 30 units and what affects defensive efficiency.
The relative importance of shooting percentages to defensive efficiency is:
- Low Paint FG%: 31%
- Corner 3pt FG%: 22%
- Mid-Range FG%: 19%
- Non-Corner 3pt FG%: 19%
- High Paint FG%: 8%
The relative importance of shot selection to defensive efficiency is:
- Non-Corner 3pt Shots: 36% (decrease shots from here)
- Corner 3pt Shots: 24% (decrease shots from here)
- Mid-Range Shots: 17% (increase shots from here)
- Low Paint Shots: 12% (decrease shots from here)
- High Paint Shots: 11% (increase shots from here)
Lineups that do well in this data set protect the paint and defend the perimeter. This fits well with the conventional wisdom, I’d say, but I’m glad to be able to attach some numbers to the importance of each.
[…] the relationship between shooting and defensive efficiency has made me wonder what, if anything, we can learn by rating a player’s impact on shooting […]
The Relationship Between Shooting and Defensive Efficiency
https://jurnal-investigasi.com/menilik-fakta-kuala-dua-belas-desa-yang-viral-akibat-sterofoam/
The Relationship Between Shooting and Defensive Efficiency
http://ee.dobro.ee/2016/09/29/smogut-li-estonskie-dizajnery-konkur/
The Relationship Between Shooting and Defensive Efficiency
https://www.advancedoptometry.net/2017/10/28/winter-weather-eyes/
The Relationship Between Shooting and Defensive Efficiency
https://www.theadrenalinetraveler.com/2017/02/03/es-que-esto-cura-cualquier-cosa/
The Relationship Between Shooting and Defensive Efficiency
https://astifoundation.com/asi-es-el-nuevo-programa-de-stem-talent-girl-online/